Observability Optional
Observability is essential for operating web services effectively. This template connects Next.js with OpenTelemetry, enabling you to trace through to the database layer using Prisma. In the local environment, the setup includes routing through an OpenTelemetry Collector and visualizing the traces in Jaeger.
For production environments, it is recommended to use the OpenTelemetry Collector as a sidecar and integrate with platforms such as Datadog for advanced monitoring and analysis.
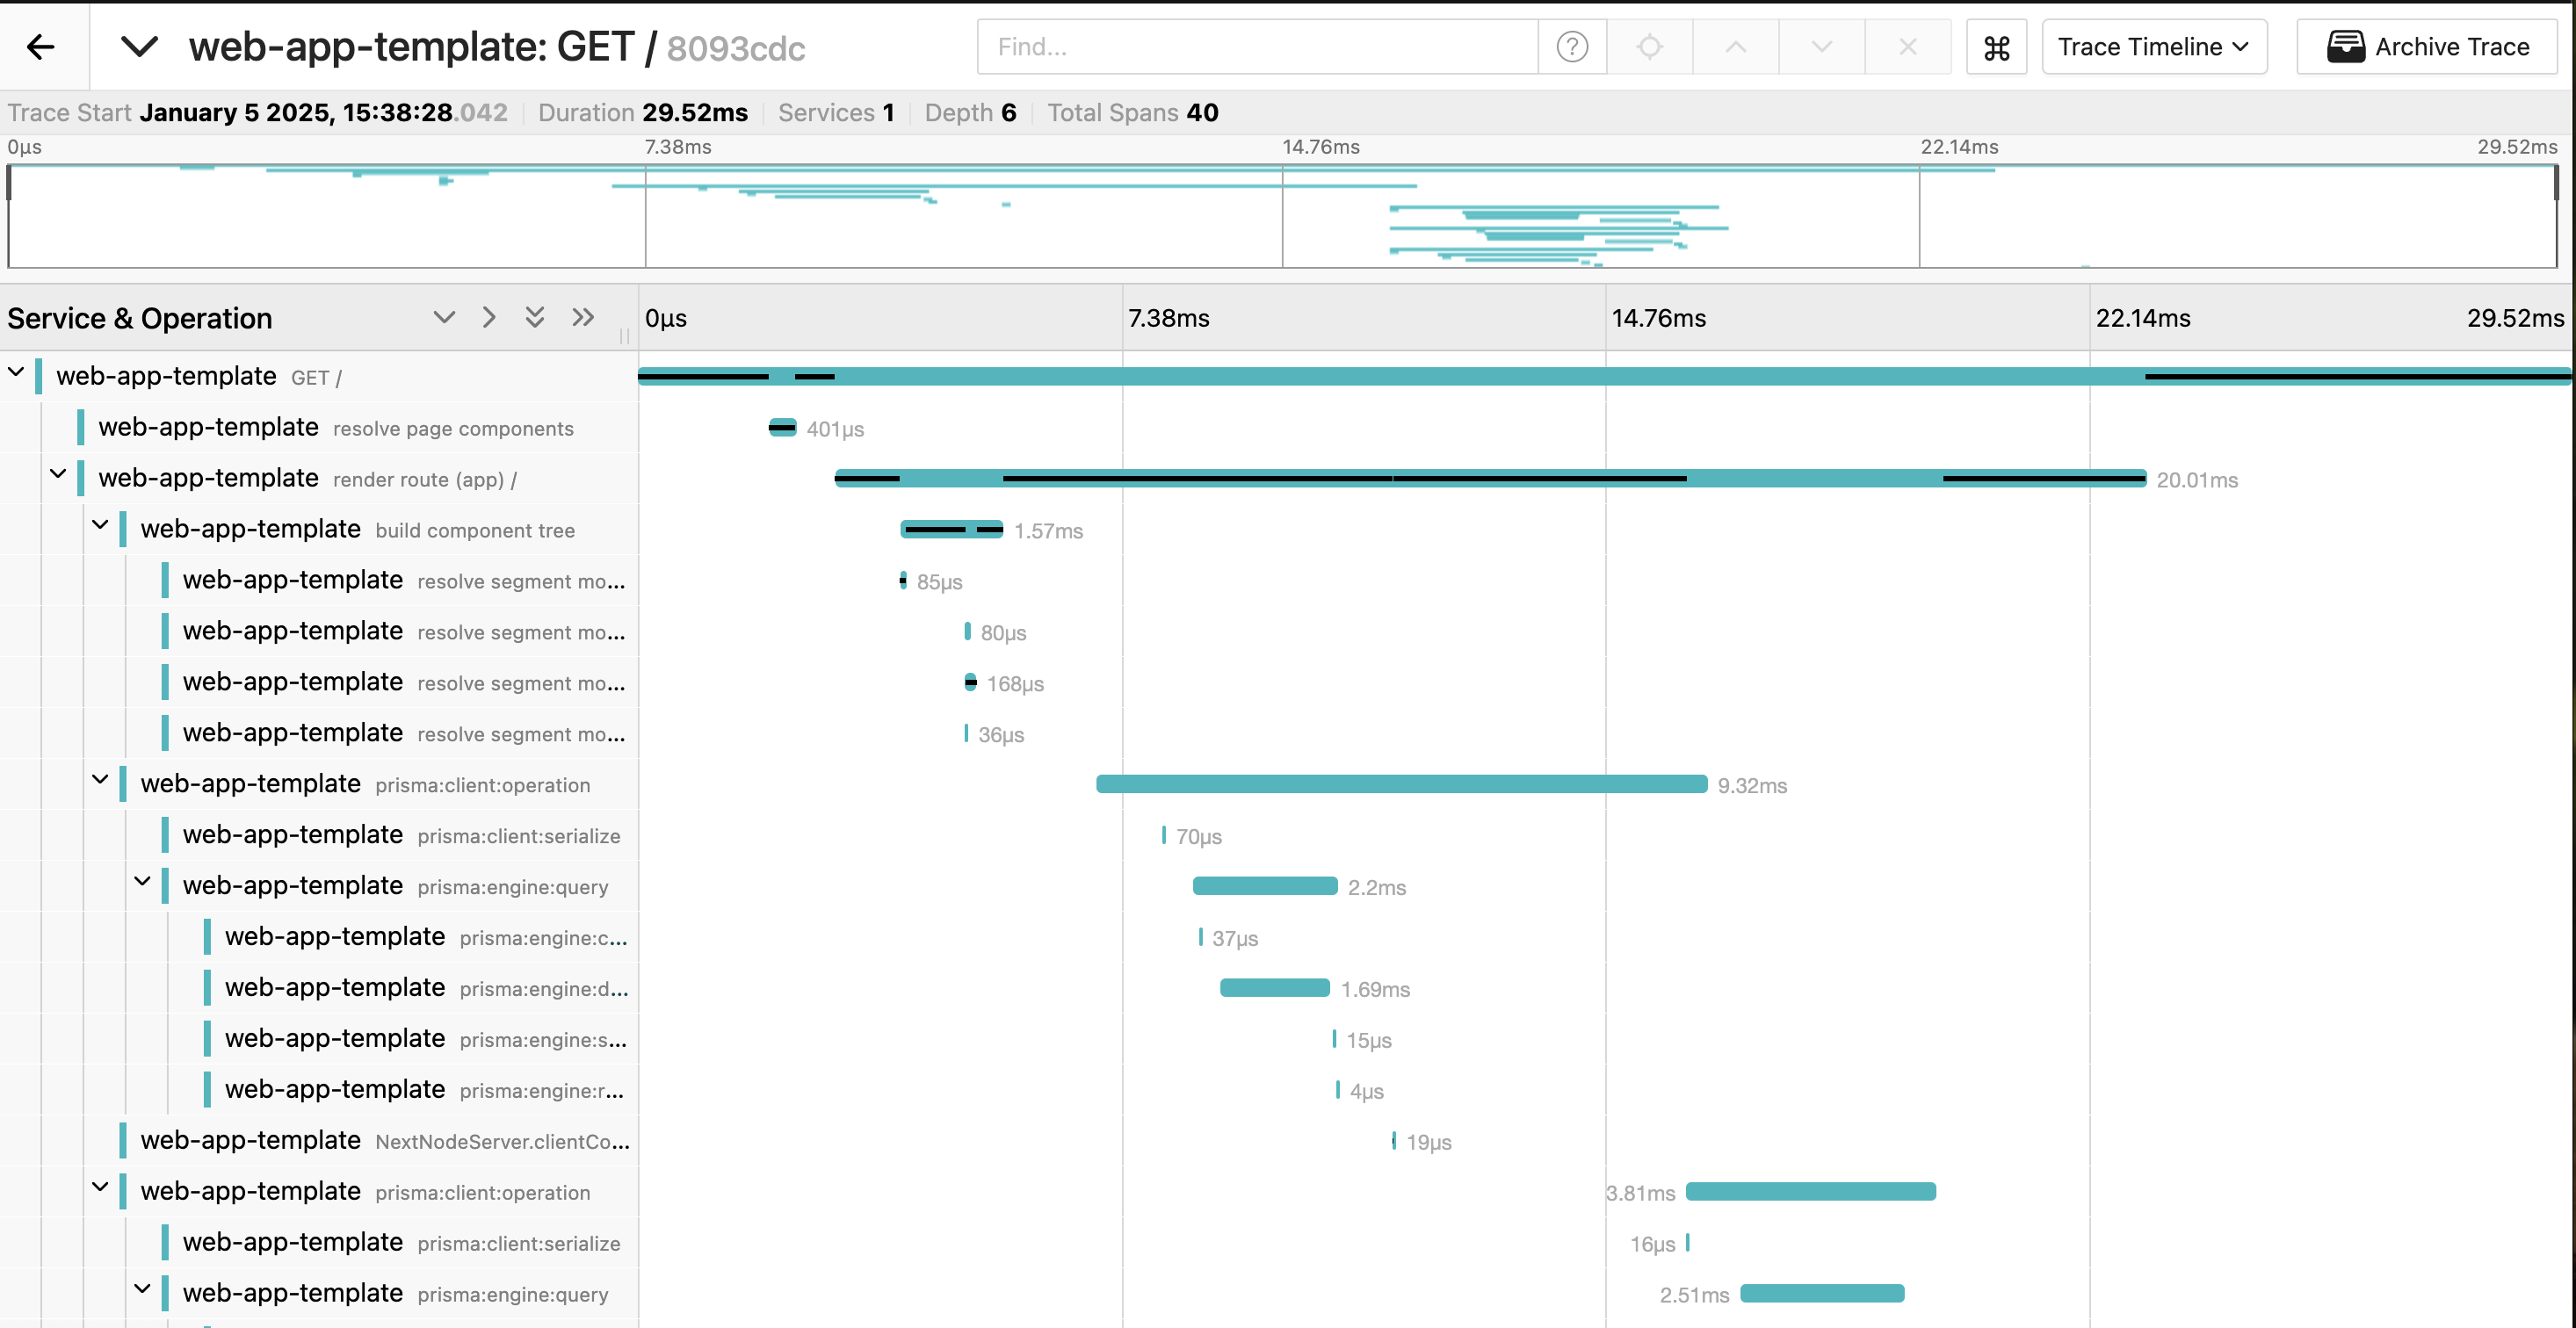
The Tracing data of Top Page
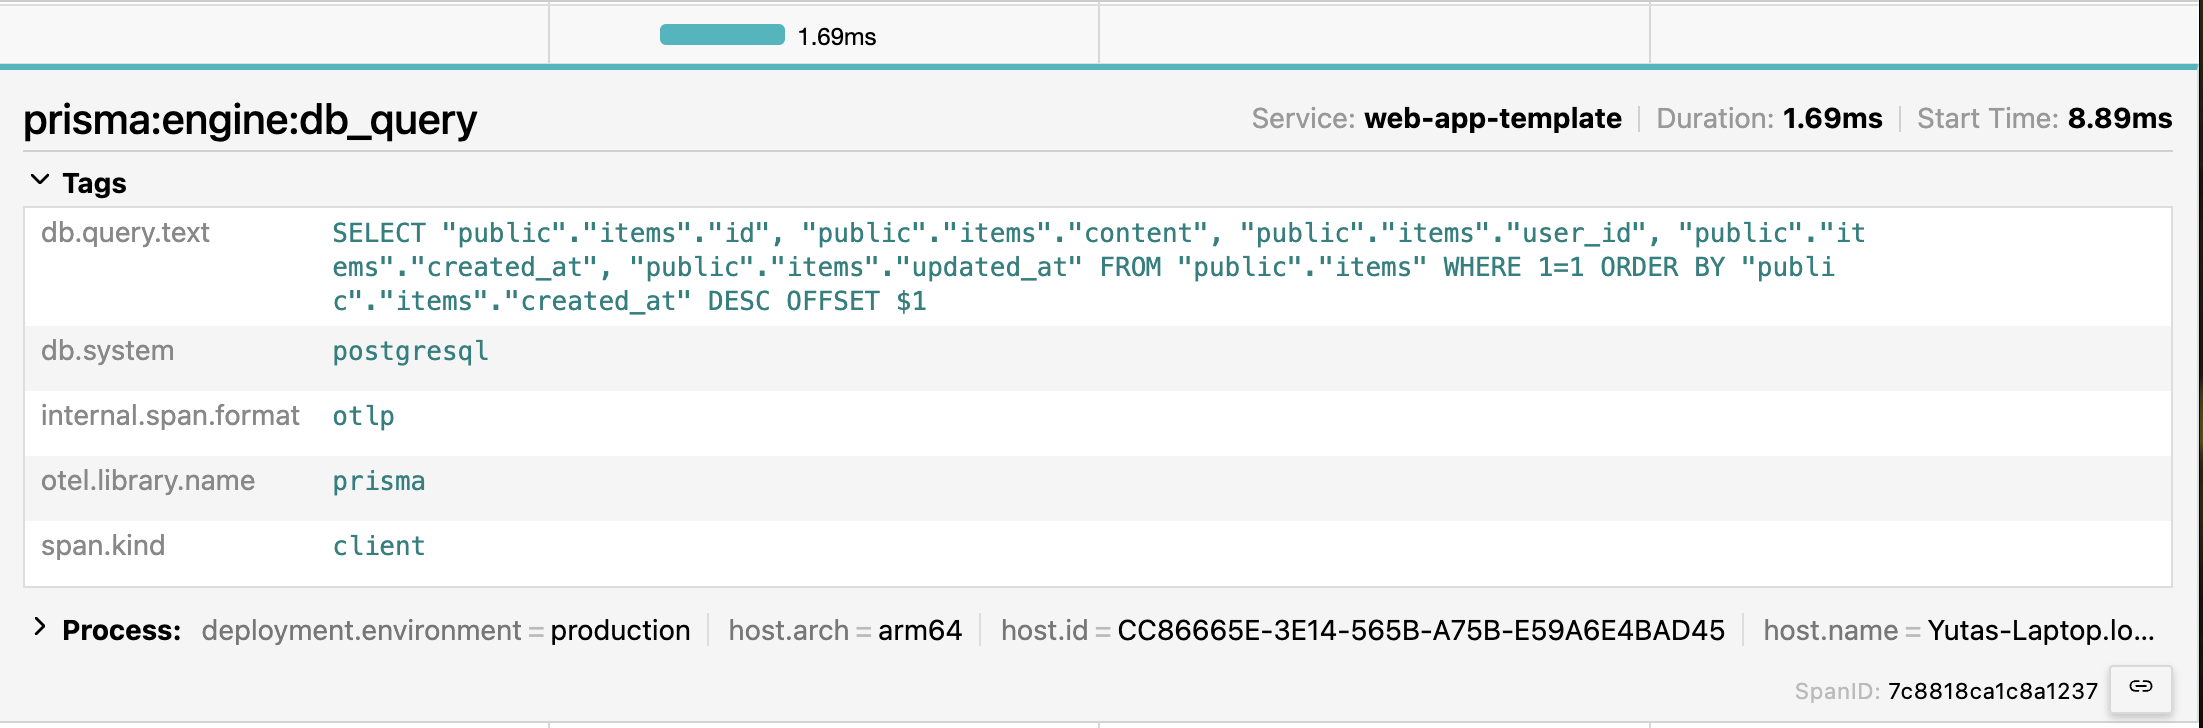
The SQL and Prisma
OpenTelemetry
ts
import { OTLPMetricExporter } from "@opentelemetry/exporter-metrics-otlp-grpc";
import { OTLPTraceExporter } from "@opentelemetry/exporter-trace-otlp-grpc";
import { HttpInstrumentation } from "@opentelemetry/instrumentation-http";
import { resourceFromAttributes } from "@opentelemetry/resources";
import { PeriodicExportingMetricReader } from "@opentelemetry/sdk-metrics";
import { NodeSDK } from "@opentelemetry/sdk-node";
import { BatchSpanProcessor } from "@opentelemetry/sdk-trace-base";
import { ATTR_SERVICE_NAME } from "@opentelemetry/semantic-conventions";
import { PrismaInstrumentation } from "@prisma/instrumentation";

const resource = resourceFromAttributes({
  [ATTR_SERVICE_NAME]: "web-app-template",
  "deployment.environment": process.env.NODE_ENV,
});

const url = process.env.TRACE_EXPORTER_URL || /* for local */ undefined;

const traceExporter = new OTLPTraceExporter({
  url,
});

const spanProcessor = new BatchSpanProcessor(traceExporter);

const instrumentations = [
  new HttpInstrumentation(),
  new PrismaInstrumentation(),
];

const metricReader = new PeriodicExportingMetricReader({
  exporter: new OTLPMetricExporter(),
});

const sdk = new NodeSDK({
  resource,
  traceExporter,
  spanProcessor,
  instrumentations,
  metricReader,
});

sdk.start();
yml
volumes:
  db-data:

services:
  db:
    image: postgres:17
    ports:
      - ${DATABASE_PORT:-5432}:5432
    environment:
      - POSTGRES_USER=${DATABASE_USER}
      - POSTGRES_PASSWORD=${DATABASE_PASSWORD}
      - POSTGRES_DB=${DATABASE_DB}
    # https://admin.alyfoods.com/blog/testcontainers-volume-mount-failure-debugging
    # volumes:
    #   - db-data:/var/lib/postgresql/data
    healthcheck:
      test: ["CMD-SHELL", "pg_isready"]
      interval: 1s
      timeout: 5s
      retries: 10
  # start: otel #
  jaeger:
    image: jaegertracing/all-in-one
    ports:
      # https://www.jaegertracing.io/docs/1.6/getting-started/#all-in-one-docker-image
      # frontend
      - 16686:16686
      - 14268
      - 14250
    environment:
      - METRICS_STORAGE_TYPE=prometheus
      - PROMETHEUS_QUERY_SUPPORT_SPANMETRICS_CONNECTOR=true
      - COLLECTOR_OTLP_ENABLED=true
  # don't use contrib on prod
  # https://opentelemetry.io/blog/2024/otel-collector-anti-patterns/#3--not-using-the-right-collector-distribution-or-not-building-your-own-distribution
  otel-collector:
    image: otel/opentelemetry-collector-contrib
    command: ["--config=/conf/otel-collector-config.yml"]
    volumes:
      - ./otel-collector-config.yml:/conf/otel-collector-config.yml
    ports:
      - 13133:13133 # health_check extension
      - 4317:4317 # OTLP gRPC receiver
    depends_on:
      - jaeger
  # end: otel #